
WEIGHTED PIPELINE FORECAST BUYER CAPACITY
Weighted Pipeline Forecasts When Buyer Capacity Is Unknown
A weighted pipeline forecast multiplies each open deal’s value by an expected revenue rate. Most models derive that rate from sales stage alone, but high-ticket teams may also need to account for whether the buyer can afford the offer.
Watch a contact get pre-qualified.
This is exactly what your CRM gets back.
Your opt-in form
Soft pull · no impact to their credit
This is not a real soft pull. It's an example of the data points that land in your CRM contact record when a lead fills out your form.
LEADFI DEMO
Watch the demo, then start free or book a call.
GUIDE
Why stage probabilities can overstate deals the buyer cannot afford
Stage probability reflects movement through a sales process. It does not establish whether the buyer can afford the offer. A deal may reach proposal because discovery went well, yet stall when the buyer considers the price.
Stage movement is not buying power
A stage records an event such as a completed call or sent proposal. It can reflect intent and rep activity, but it does not establish buying power. This distinction becomes especially important for offers priced around $1,000–$10,000 or more.
Self-reported capacity can distort the view
Intake questions about budget or income can support discovery, but the answers remain self-reported. An authorized financial-readiness workflow can instead assign a band after submission. Depending on the configured workflow, source signals may include VantageScore 4.0, income, debt, available credit, or debt-to-income ratio. Sales users should see only the resulting band or route—not those underlying values.
SQL and NQL need plain definitions
An SQL can afford the offer being sold. An NQL is not financially fit to buy that offer. These labels guide routing rather than judging the person.
SQLs can enter the primary high-ticket sales path. NQLs should move to a lower-ticket offer or another product that fits the buyer’s financial capability. Payment plans, deposit terms, discounts, and other payment options should follow one written policy applied consistently to every buyer—not an individual readiness result.
No result is not an NQL
A readiness result may not return for every authorized intake. Keep those records in a distinct no result group. Missing data does not mean the person is financially unfit, and combining no-result records with NQLs will distort the forecast.
Readiness does not predict one person
A readiness band does not predict whether an individual deal will close or whether a buyer would receive financing. It is a routing input and a field for analyzing groups of deals. Forecast weights must come from the business’s own historical outcomes rather than an industry benchmark.
INTELLIGENCE LAYER
Carrying the intake readiness band onto each open deal
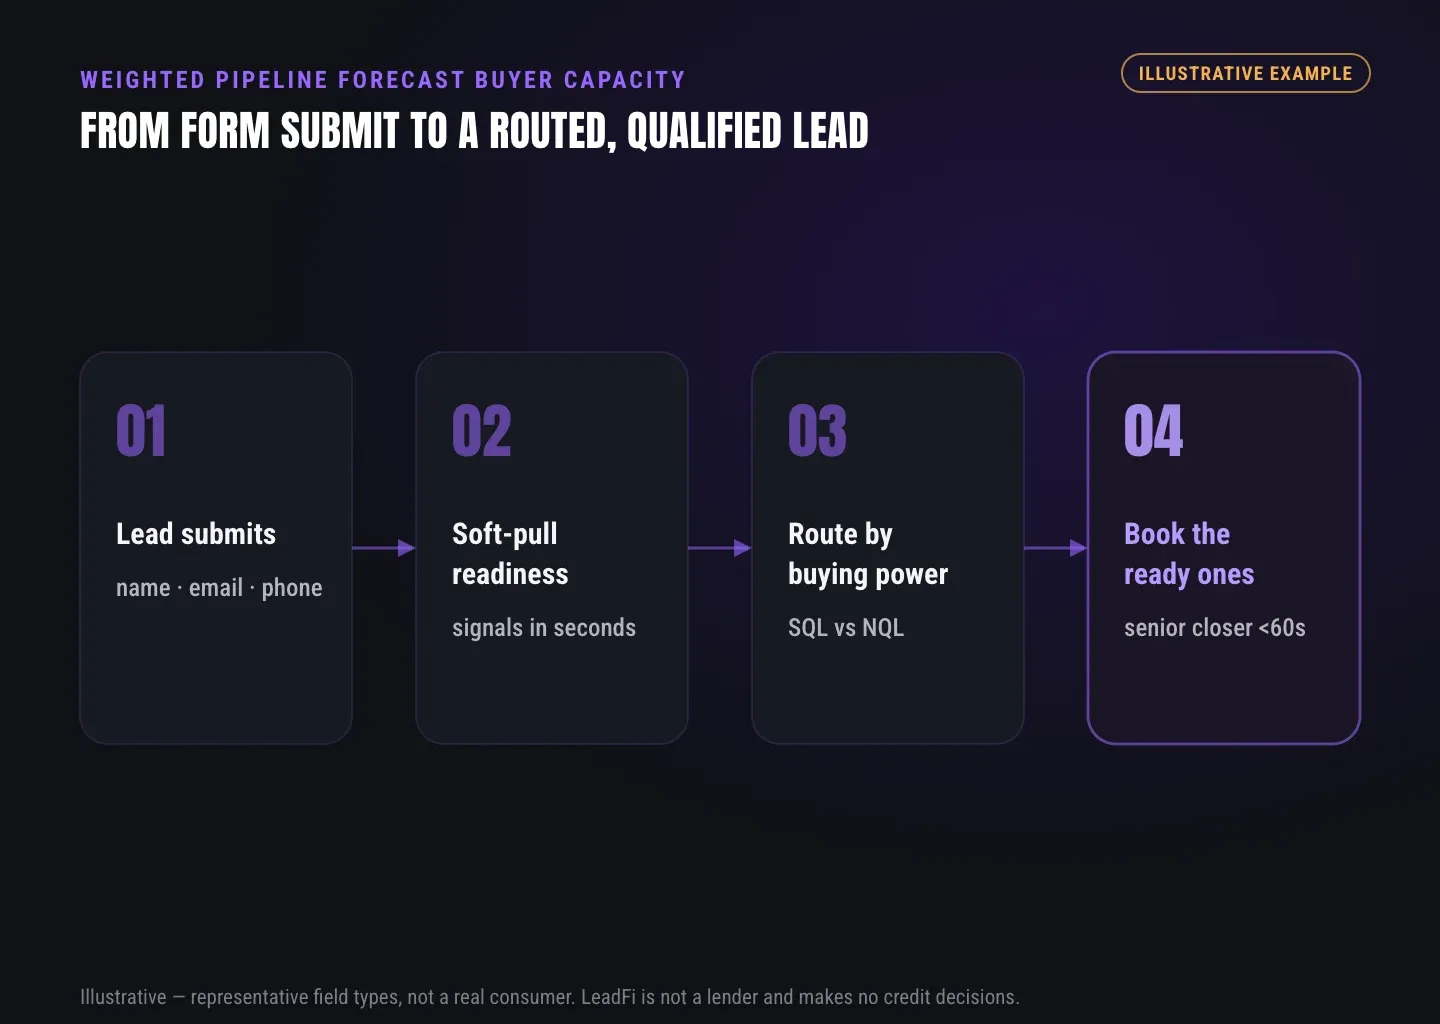
The readiness band should enter the CRM after the lead submits through the business’s authorized intake flow. LeadFi can work from name, email, and phone and return a configured SQL, NQL, or no-result route through an API, webhook, automation connector, or native workflow.
Use only readiness results the business already holds from its own intake form, collected with its disclosures and the lead’s authorization. Do not run new checks on open deals, past leads, or existing customers for forecasting or reporting.
Capture the result after submission
Store the route on the contact and related opportunity after the configured workflow completes. The forecast can then group open deals by sales stage and intake route without exposing underlying financial values to setters, closers, or managers.
Keep the intake band fixed
Preserve the initial band, result time, related offer, and rule version as point-in-time fields. Do not overwrite the original result when the opportunity changes stage. If business rules change, create a new version so analysts can compare records governed by the same definitions.
Store a route, not raw values
The sales view should show SQL, NQL, or no result, plus the assigned path. It should not display or quote a person’s VantageScore 4.0, income, debt, debt-to-income ratio, or available-credit values.
Keep offer context beside the band
Financial fit depends on the offer. A buyer may fit one product but not a higher-priced service, so every forecast record should retain the offer and price context used during intake. When the offer or qualification rules change, start a new analysis group rather than assuming an old band has the same meaning.
Handle missing results with care
Track no-result records separately and retain a reason code when available. A missing result may reflect an incomplete match, form-data issue, or workflow interruption. It should never be converted to NQL by default.
GUIDE
Weighting the roll-up by stage and band together
The clearest weighted pipeline forecast uses a stage-by-band matrix calculated from the business’s own closed-revenue history. Each cell represents the share of snapshot pipeline value that became closed revenue within a fixed outcome window.
Start with a joint-rate matrix
Create rows for sales stages and columns for SQL, NQL, and no result. Calculate each cell’s rate using realized closed revenue divided by the open amount recorded in the original snapshot. Apply the same outcome window to every cohort.
Apply the basic formula
Weighted deal value = open deal amount × observed stage-and-band realization rate
Weighted pipeline forecast = sum of all weighted deal values
The deal amount comes from the CRM, while the applicable rate comes from the historical stage-and-band cohort. The rate estimates group revenue; it does not predict the outcome of one opportunity.
Avoid arbitrary readiness multipliers
Do not assign untested factors to SQLs, NQLs, or no-result records. Derive rates from your own data. If the sample is too small, use broader groups and document the active model instead of presenting unstable precision.
Use a fallback when data is sparse
A temporary fallback can begin with the business’s stage rate and a capped group index based on its own aggregate outcomes. Document the formula, cap, active dates, and review schedule. Replace the fallback with a direct joint matrix when enough closed records are available.
Worked example: hypothetical only
Assume a business has $200,000 in proposal-stage pipeline. A hypothetical 40% stage-only rate produces an $80,000 forecast. These numbers are illustrative and are not industry benchmarks.
The pipeline contains three groups:
- SQL: $120,000 at a hypothetical 50% observed joint rate = $60,000
- NQL: $50,000 at a hypothetical 10% observed joint rate = $5,000
- No result: $30,000 at a hypothetical 35% observed joint rate = $10,500
The hypothetical joint forecast is $75,500. The point is not that joint weighting always lowers a forecast. It is that the model shows which stage-and-readiness groups contribute to the total.
See which of the leads you already have can actually afford to buy.
GUIDE
Checking the forecast against closed revenue each month
A weighted pipeline forecast becomes useful only when the team compares it with actual closed revenue. Review total error and cohort-level error because one group can offset another and make the overall result look accurate.
Freeze a monthly snapshot
On a consistent forecast date, save every open opportunity’s amount, stage, readiness band, offer, expected close date, owner, intake date, result date, and rule version. This prevents later stage changes from rewriting the historical forecast.
Use a fixed outcome window
Choose a window that reflects your sales cycle, such as 30, 60, or 90 days, and apply it consistently. Build the baseline from your own data rather than adopting external or industry rates.
Measure dollar error
Use a straightforward variance calculation:
Forecast variance = actual closed revenue − weighted forecast
Keep dollar error beside any percentage metric, particularly when actual revenue is low. Do not rebuild the model because of one unusual month; use a documented review schedule.
Check calibration by cohort
Compare forecast and actual revenue for every stage-and-band group, including no result. Also track readiness-result coverage, workflow completion, rule-version consistency, and stage discipline. Clean data matters more than additional decimal places.
Managers can retain a separate documented forecast when they know current deal facts the historical model cannot capture. Preserve the model output, manager override, reason, and actual result as distinct fields.
Keep compliance setup tied to intake
Forecasting does not replace a sound intake workflow. Before launch, align form language, privacy notices, consent and disclosures, routing rules, and CRM actions. LeadFi supports compliance-aware workflows and can help teams evaluate privacy- and consent-oriented setup. LeadFi does not provide legal advice or guarantee compliance; clients should review their use case with counsel.
GUIDE
A practical monthly forecasting process
A repeatable process is more useful than an unnecessarily complex model:
- Capture the lead: Receive an existing inbound submission through the business’s authorized form or funnel.
- Return the route: Write SQL, NQL, or no result into the CRM after the configured readiness workflow.
- Assign the next step: Send SQLs to the main offer path and NQLs to a lower-ticket or financially fitting product.
- Create the opportunity: Store the offer, amount, stage, intake band, result date, and rule version.
- Freeze the snapshot: Save all open opportunities on the monthly forecast date.
- Apply joint rates: Weight each amount using the applicable stage-and-band rate from the business’s own history.
- Wait for the outcome window: Allow the documented measurement period to pass.
- Compare outcomes: Measure actual closed revenue against the forecast.
- Review data gaps: Check no-result records, missing fields, inconsistent stages, and routing errors.
- Update with control: Revise weights on a set schedule rather than after one unusual result.
Publish the snapshot date, outcome window, model version, result coverage, and manager overrides with every forecast. These details make the roll-up reproducible and easier for sales, operations, and finance to review.
Related reading: a practical guide to sales lead qualification, practical insights on prequalifying leads before the sales call, a closer look at financial readiness signals for sales teams.
| Forecast approach | Data used | Main benefit | Main limit |
|---|---|---|---|
| Unweighted pipeline | Open deal amount | Shows total pipeline size | Treats every dollar equally |
| Stage-only forecast | Amount and sales stage | Reflects process progress | Does not include intake readiness |
| Stage plus readiness | Amount, stage, and intake band | Tests buyer-capacity cohorts | Requires clean fields and enough history |
| Manager forecast | Documented human judgment | Adds current deal context | Can vary by owner and period |
| Blended view | Joint model plus documented override | Preserves data and judgment | Requires clear override rules |
Key takeaways
The short version
- Combine sales stage with the intake readiness band.
- Build forecast weights from your own closed revenue.
- Route NQLs to a lower-ticket or financially fitting product.
- Keep no-result records separate from NQLs.
- Show sales teams the route, not raw financial values.
Quick answers
Fast answers before you dig in
How do you add buyer capacity to a weighted pipeline forecast?
Group opportunities by both sales stage and the authorized readiness band captured at intake, then apply realization rates calculated from your own closed-revenue history.
How should no-result leads be forecast?
Keep no-result records in a separate cohort. A missing result is not an NQL and should receive its own historical rate only after enough outcomes exist.
Does a readiness-aware forecast predict which deal will close?
No. The readiness band is a routing input and group-analysis field; it does not predict an individual deal, financing outcome, or consumer decision.
What should sales users see in the CRM?
Sales users should see the SQL, NQL, or no-result route and assigned path—not raw score, income, debt, debt-to-income, or available-credit values.
FAQ
Common questions
What is a weighted pipeline forecast?
How does financial readiness improve a weighted pipeline forecast?
What is the difference between stage probability forecasting and readiness weighting?
Should NQL deals count in the high-ticket weighted pipeline forecast?
How should no-result records appear in a weighted pipeline forecast?
Can a soft pull support a weighted pipeline forecast?
Can LeadFi add readiness fields to an existing CRM workflow?
Sources
References
- CFPB — What is a credit inquiry? (hard vs. soft) (opens in a new tab)Federal regulator confirms a soft inquiry, unlike a hard inquiry, does not affect the consumer's credit score.
- VantageScore — VantageScore 4.0 credit scoring model (opens in a new tab)Official page describing VantageScore 4.0, the tri-bureau, trended-data model used to assess credit risk.
- CFPB — Who can request to see my credit report? (opens in a new tab)Federal regulator explains the FCRA rules governing who may obtain a credit report.
Know who is ready before your next sales call.
Sales stage shows how far an opportunity has moved. An authorized readiness route adds context about whether the lead could afford the offer at intake.